Page 410 - MORPHOLOGIE DES STRUCTURES
P. 410
www.academieroyale.be
410 LES PORTIQUES
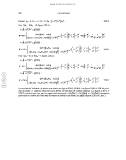
( )Lorsque p2 = 0 ( k = ∞ ) : W = Z L h1 + 1 + b2 H 2 H L . 2.20.2.
Pour L h1 = H h2 = 10 (figure 2.20.3.) :
– si 1 + H2 b2 ≥ 1 (40Z ) :
( )
(b H ) Ω1 Ω2 − Ω1 Ω3 b2 1+ H2 1+ H2 + 1 2
1 H2 H +1 b b2 b2 80Z 1 H
W = 10Z + + + L k + 20Z 1+ H2 .
3/2 H b2 L2
2 (Ω1 Ω2 + Ω1 Ω3 ) H L + 4 ( H b) 1 + H 2 b2
– si 1 + H2 b2 ≤ 1 (40Z ) :
( )
(b H ) Ω1 Ω2 − Ω1 Ω3 b2 H2 H2
W = 10Z + Ω2 + Ω1 Ω3 ) H L + 4 ( H b) 1 + H 2 + 1 + H2 H + 1 b 2 + b2 L2 . 2.20.3.
3/2 L k H
2 (Ω1 b2
Pour L h1 = 10 et H h2 = 5 (figure 2.20.4.) :
– si 1 + H2 b2 ≥ 1 (20Z ) :
( )
(b H ) Ω1 Ω2 − Ω1 Ω3 b2 1 + H2 1+ H2 + 1 2
Ω2 + Ω1 Ω3 ) H L + 4 ( H b) 1 + H 2 + 1 + H2 H 1 b b2 b2 40Z 1 H
W = 10Z + L + k H + 10Z .
3/2 1+ H2 b2 L2
2 (Ω1 b2
– si 1 + H2 b2 ≤ 1 (20Z ) :
( )
(b H ) Ω1 Ω2 − Ω1 Ω3 b2 H2 H2
W = 10Z + Ω2 + Ω1 Ω3 ) H L + 4 ( H b) 1 + H 2 + 1 + H2 H + 1 b 2 + b2 L2 . 2.20.4.
3/2 L k H
2 (Ω1 b2
Les courbes de l’indicateur de volume sont tracées aux figures 2.20.3. à 2.20.8. Les figures 2.20.9. à 2.20.14. préci-
sent les angles α optimum nécessaires pour obtenir un indicateur de volume minimum. Les figures 2.20.15. à
2.20.32. précisent pour leur part les rapports adimensionnels σ Ω1 ( p1L) , σ Ω2 ( p1L) et σ Ω3 ( p1L) nécessaires
pour tracer les courbes de l’indicateur de volume du portique sans tirants aux appuis (figures 2.20.3 et 2.20.4.).

