SEO Version


60
Influence of a cover on noise levels
The noise levels experienced by a listener in open air are mainly determined by
the nature and the volume level of the source, and by the distance between the
source and the listener. In a closed space, even one containing large openings, the
sound pressure level will always be higher, because of the reverberations caused by
physical boundaries.
An inevitable side effect of the cover is consequently the amplification of the noise
levels on the platforms. This can be very inconvenient in the case of very loud sound
sources such as the passing through of a train at high speed. In this paragraph
we will analyze which increase in noise levels can be expected under the cover.
This analysis will indicate to what extend noise control measures will have to be
implemented to avoid this inevitable effect.
The calculation was made using a numerical, geometric model. Simple formulas for
statistical room acoustic s do not yield reliable results for sound sources in such a
large volume. A calculation was made for the sound dispersion rate of a line source
with a length of 100 m on track 3
(fig. 2)
. The source was given a sound power level
of 0
dB/m. Real sound levels are of course higher than the calculated one, because a real
sound level has a greater sound power level. This analysis, however, is concerned
with the differences between variants, and these are evaluated correctly since the
calculated sound reductions are exact.
The figures 4.1 - 4.2 indicate the dispersion of the sound pressure level on the
platform in two different situations, both with a sound source on track 3, with a
length of 100 m, Lw =
0
dB/m
(fig. 3)
.
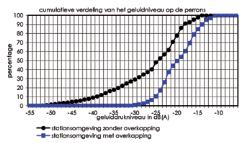
Figure 5 shows a graphic summary of both sound card calculation results indicating
the cumulative dispersion of the sound levels on the platforms. In open air there are
of course more positions, located at a farther distance from the source, where the
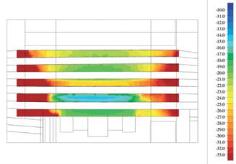
fg 4.1 The station environment without covering.
Boundary condition: calculations were made for the station
buildings only, without including the platform canopies, which
produced the optimum decrease in noise levels.
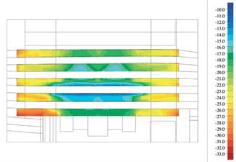
fg 4.2 The station environment with covering, competition design.
Boundary condition: platform furnishings were not taken into
account.
fg 5 Cumulative dispersion of sound levels on the platforms. Both
graphs indicate the percentage of foor area (Y-axis) where a given
sound level (X-axis) is not exceeded.
Remark: the absolute values of the sound levels are insignifcant,
but the relative values (differences) are correct.
fg 4.1
fg 4.2
fg 5
roof without sound absorption
cover with a sound-absorbent roof
cumulative distribution of noise on the platforms
sound pressure level in dB (A)
Powered by FlippingBook Publisher