200
EUROPA
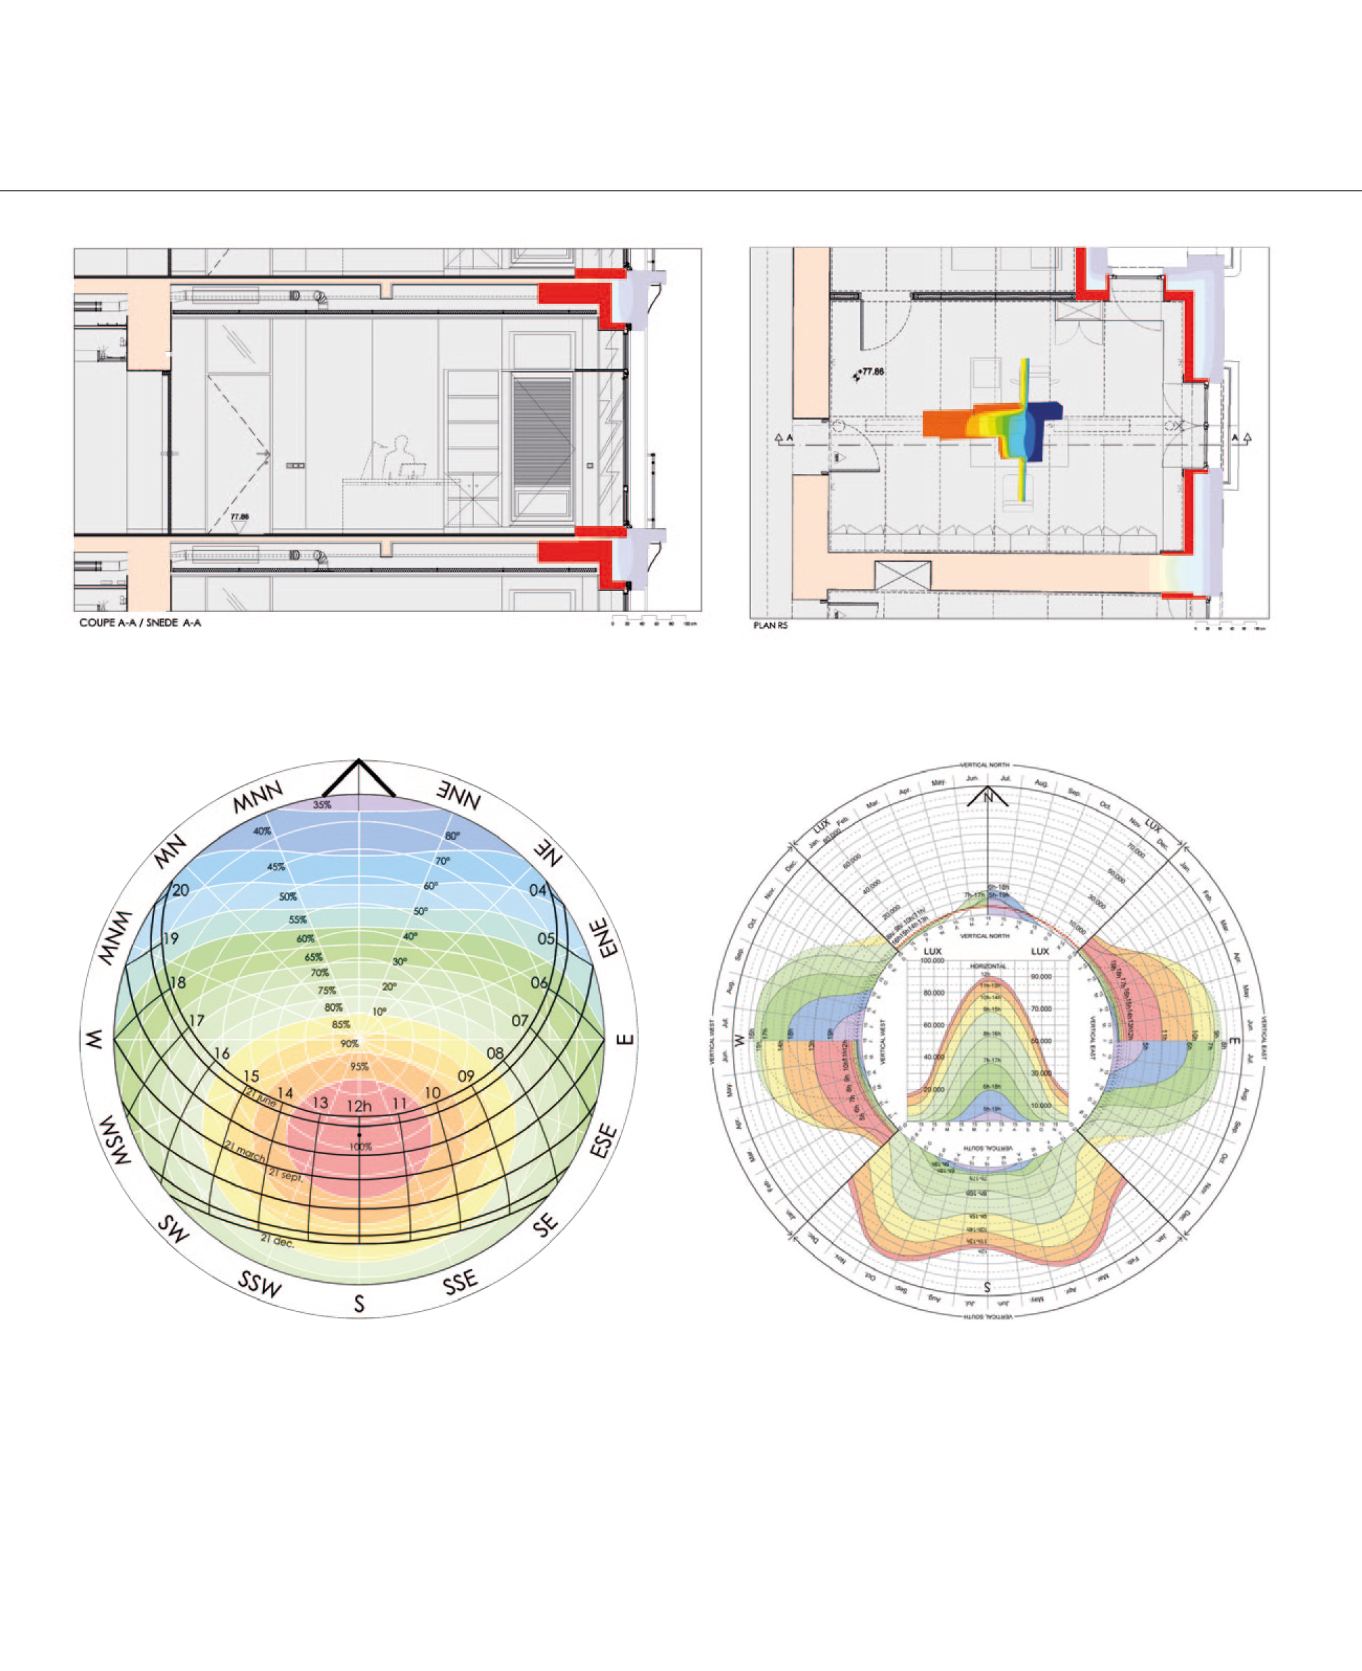
Annual average of the solar energy
harvesting in Belgium (51°N) depending
on aspect and incline of a surface. The
white rays correspond to the aspect
and the white circles correspond to the
incline on the horizontal, the centre being
the horizontal (0°) and the circle at the
end being the vertical (90°).
The coloured curves correspond to
harvesting between 1100 kWh/m²/year
(100%: red) and 385 kWh/m².year (35%:
purple).
The black arched grid corresponds to
the sun’s trajectories with every passing
hour and every passing month of the year.
The top line corresponds to the sun’s
trajectory on 21 June (summer solstice),
the bottom line to that of 21 December
(winter solstice) and the central line that
of 21 September and 21 March (autumn
and spring equinox).
Overall illumination with a clear sky on
a horizontal surface (central diagram) or
vertical (peripheral diagrams) oriented
towards one of the four cardinal points, in
Belgium (51°N).
The coloured curves represent the hours
of the day whilst the graduated grid
illustrates illumination (in lux) depending
on the month of the year.
Horizontal and cross section of the insulation from the inside of the listed façade for the study of the temperature factor through
two-dimensional and three-dimensional digital simulation of the evaluation of condensation risks carried out by the CSTC.
WORK IN PROGRESS


